How to Debug Code?
In Chatium, you can use the following methods to collect logs:
ctx.account.log(), if we want to send them to "Account Logs".ctx.log(), to see them in the browser console or in VSCode.
Let's look at some examples.
ctx.account.log()
We'll write a simple program that returns the current time in the logs.
const date = new Date().toISOString().slice(0, 19).replace('T', ' ')

app.html('/', async ctx => {
   ctx.account.log(`Current time: ${date}`)
  return (
    <HtmlLayout title={'Page Title'}>
      <h1>Log Collection Example</h1>
    </HtmlLayout>
  )
})
ctx.log()
For the second method, let's add ctx.log():
ctx.log(`Current time 2: ${date}`)
This method outputs the log to the browser console or VSCode and allows you to see the logs of a specific run in your browser or VSCode.
VSCode
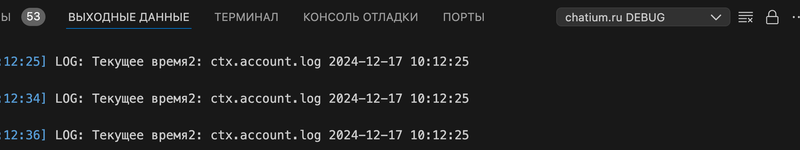
First, let's look at the logs in VSCode.
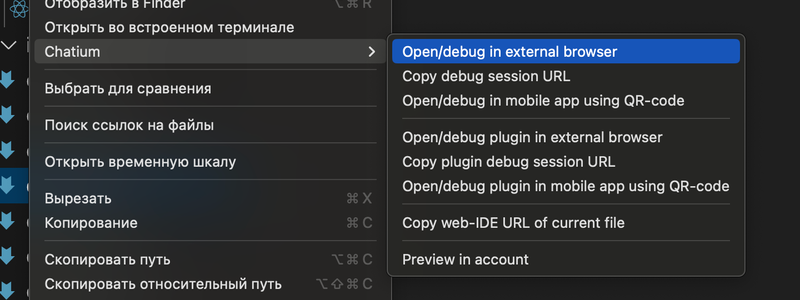
In VSCode, right-click on the code file -> Chatium -> open/debug in external browser.
Now, go to Output and see that with each page refresh, the logs come in and are displayed correctly.
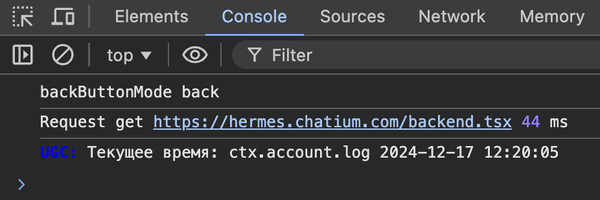
Browser Console
To see the logs in the console, you need to:
- Open the code in the development environment at the address
{your account domain}/s/ide/path_to_your_file.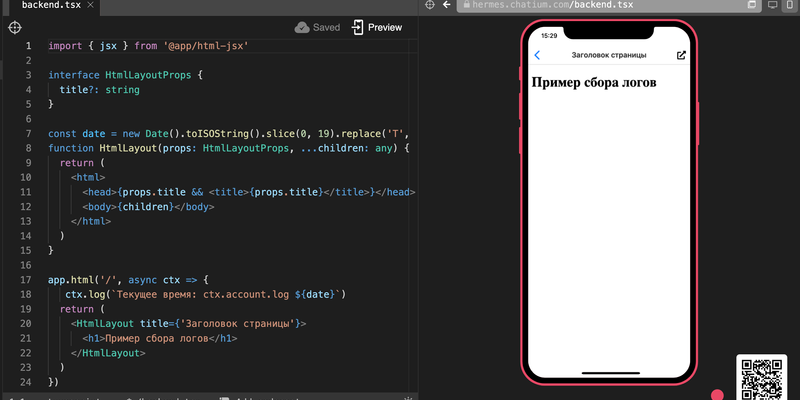
- Open the browser console and click the preview button.
You will see our logs displayed in the console, but they only appear once since the file is built on the server. To see the logs again, you need to change the file and save it again.